Difference between revisions of "Shared:Group 1"
Marco Galli (Talk | contribs) (→LOCAL | The site) |
Marco Galli (Talk | contribs) |
||
| (11 intermediate revisions by one user not shown) | |||
| Line 71: | Line 71: | ||
[[File:Rtdm2-02.jpg|850px]] | [[File:Rtdm2-02.jpg|850px]] | ||
| + | |||
| + | <span style="color:#FFFFFF; background:#0071BC"> '''shared folder>'''</span> https://www.dropbox.com/sh/dv6ud27uvjczd3b/AACZ2GdX26JNtdaCB6EWQvmXa?dl=0 | ||
== <span style="color:#FFFFFF; background:#0071BC"> '''GLOBAL''' </span> <span style="color:#FFFFFF"> | </span> Climate Change == | == <span style="color:#FFFFFF; background:#0071BC"> '''GLOBAL''' </span> <span style="color:#FFFFFF"> | </span> Climate Change == | ||
| + | <span style="font-size: 20px; color: black;"> | ||
'''Energy Sector Faces Major Challenges from Climate Change''' | '''Energy Sector Faces Major Challenges from Climate Change''' | ||
| + | |||
Without strong mitigation policies, the global average temperature is likely to rise above the internationally agreed 2°C target. As a major source of carbon emissions, the energy sector will be aected by mitigation policies as well as by climate impacts in multiple ways. | Without strong mitigation policies, the global average temperature is likely to rise above the internationally agreed 2°C target. As a major source of carbon emissions, the energy sector will be aected by mitigation policies as well as by climate impacts in multiple ways. | ||
| Line 82: | Line 86: | ||
''check out complete infographic: http://www.desmog.ca/sites/beta.desmogblog.com/files/IPCC_AR5__Implications_for_Energy__Infographic__WEB_EN.pdf'' | ''check out complete infographic: http://www.desmog.ca/sites/beta.desmogblog.com/files/IPCC_AR5__Implications_for_Energy__Infographic__WEB_EN.pdf'' | ||
| + | <span style="font-size: 20px; color: black;"> | ||
'''Cities on the front line of a changing climate''' | '''Cities on the front line of a changing climate''' | ||
| + | |||
Urban centres account for more than half of the world’s population, most of its economic activity and the majority of energy-related emissions. The role of cities in reducing emissions and protecting their inhabitants is therefore central to effective climate policies. | Urban centres account for more than half of the world’s population, most of its economic activity and the majority of energy-related emissions. The role of cities in reducing emissions and protecting their inhabitants is therefore central to effective climate policies. | ||
| Line 99: | Line 105: | ||
[[File:Rtdm2-05.jpg|850px]] | [[File:Rtdm2-05.jpg|850px]] | ||
| + | <span style="font-size: 20px; color: black;"> | ||
'''North Sea 2050 Spatial Agenda''' | '''North Sea 2050 Spatial Agenda''' | ||
| Line 113: | Line 120: | ||
</html> | </html> | ||
| + | <span style="font-size: 20px; color: black;"> | ||
'''Opportunities for sustainable economic development of sea and coast''' | '''Opportunities for sustainable economic development of sea and coast''' | ||
| Line 119: | Line 127: | ||
Extracted from: http://www.noordzeeloket.nl/en/Images/North%20Sea%202050%20Spatial%20Agenda_LO%20RES_3562.pdf | Extracted from: http://www.noordzeeloket.nl/en/Images/North%20Sea%202050%20Spatial%20Agenda_LO%20RES_3562.pdf | ||
| + | <span style="font-size: 20px; color: black;"> | ||
'''Climate Time Machine''' Sea Levels - North Sea | '''Climate Time Machine''' Sea Levels - North Sea | ||
| Line 144: | Line 153: | ||
[[File:Rtdm2-08.jpg|850px]] | [[File:Rtdm2-08.jpg|850px]] | ||
| + | <span style="font-size: 20px; color: black;"> | ||
'''History of Rotterdam''' | '''History of Rotterdam''' | ||
| Line 165: | Line 175: | ||
[[File:Milou_expo2025_process_west oil port history1_Page_10.jpg|850px]] | [[File:Milou_expo2025_process_west oil port history1_Page_10.jpg|850px]] | ||
| + | <span style="font-size: 20px; color: black;"> | ||
'''Rotterdam Today | Functions and Energy of the Region''' | '''Rotterdam Today | Functions and Energy of the Region''' | ||
| Line 176: | Line 187: | ||
}} | }} | ||
| − | + | <span style="font-size: 20px; color: black;"> | |
'''Rotterdam Tomorrow | Global Hub & Europe’s Industrial Cluster''' | '''Rotterdam Tomorrow | Global Hub & Europe’s Industrial Cluster''' | ||
| Line 206: | Line 217: | ||
[[File:Milou_expo2025_process_west oil port history1_Page_19.jpg|422px]] | [[File:Milou_expo2025_process_west oil port history1_Page_19.jpg|422px]] | ||
[[File:Milou_expo2025_process_west oil port history1_Page_20.jpg|422px]] | [[File:Milou_expo2025_process_west oil port history1_Page_20.jpg|422px]] | ||
| − | |||
| Line 233: | Line 243: | ||
[[File:Site2-02.png|850px]] | [[File:Site2-02.png|850px]] | ||
| + | |||
| + | [[File:Land_formations.jpg|850px]] | ||
| + | http://www.geocaching.com/geocache/GC2YJ7C_amsterdam-trads-dikes-and-polders?guid=1b46e515-77b8-4cde-9d10-133ead2ab7ef | ||
'''WATER Data of the port''' | '''WATER Data of the port''' | ||
| Line 282: | Line 295: | ||
[[File:SITE1-12.png|850px]] | [[File:SITE1-12.png|850px]] | ||
| + | <span style="font-size: 20px; color: black;"> | ||
'''Site Topology''' | '''Site Topology''' | ||
| Line 287: | Line 301: | ||
[[File:LegendaTOP50.jpg|x450px]] | [[File:LegendaTOP50.jpg|x450px]] | ||
| − | + | <span style="font-size: 20px; color: black;"> | |
'''Refinery View''' | '''Refinery View''' | ||
| + | |||
<div align="center"> | <div align="center"> | ||
<youtube width="850" height="500" align="center">MedmmoUs8-Y</youtube> | <youtube width="850" height="500" align="center">MedmmoUs8-Y</youtube> | ||
</div> | </div> | ||
| − | + | [[File:WEB1_radiation.jpg|850px]] | |
| + | [[File:WEB1_sunpath.jpg|850px]] | ||
| + | [[File:WEB1_sunpositions.jpg|850px]] | ||
| + | [[File:WEB1_wind.jpg|850px]] | ||
| − | |||
---- | ---- | ||
| + | == <span style="color:#FFFFFF; background:#0071BC"> '''MATERIAL''' </span> <span style="color:#FFFFFF"> | </span> water == | ||
| − | + | <span style="font-size: 20px; color: black;"> | |
| − | + | ''' Water & Energy ''' | |
| − | + | ||
| − | + | ||
| − | + | ||
| − | + | ||
| − | + | ||
| − | + | ||
[[File:RTDM2-13.jpg|850px]] | [[File:RTDM2-13.jpg|850px]] | ||
| − | + | ||
| − | + | ---- | |
| − | + | ||
| + | == <span style="color:#FFFFFF; background:#0071BC"> '''group design''' </span> == | ||
| + | |||
| + | |||
| + | <gallery mode="nolines"> | ||
| + | File:Behavior-01.jpg | ||
| + | File:Behavior-02.jpg | ||
| + | File:Behavior-03.jpg | ||
| + | File:01-energy.jpg | ||
| + | File:02-networks.jpg | ||
| + | File:03-barriers.jpg | ||
| + | File:04-clusters.jpg | ||
| + | File:ref-1.jpg | ||
| + | File:ref-2.jpg | ||
| + | File:Pres_week2_4.jpg | ||
| + | </gallery> | ||
Latest revision as of 17:36, 3 November 2015
Milou van Min | Lars van Vianen | Marco Galli
shared folder> https://www.dropbox.com/sh/dv6ud27uvjczd3b/AACZ2GdX26JNtdaCB6EWQvmXa?dl=0
Contents
GLOBAL | Climate Change
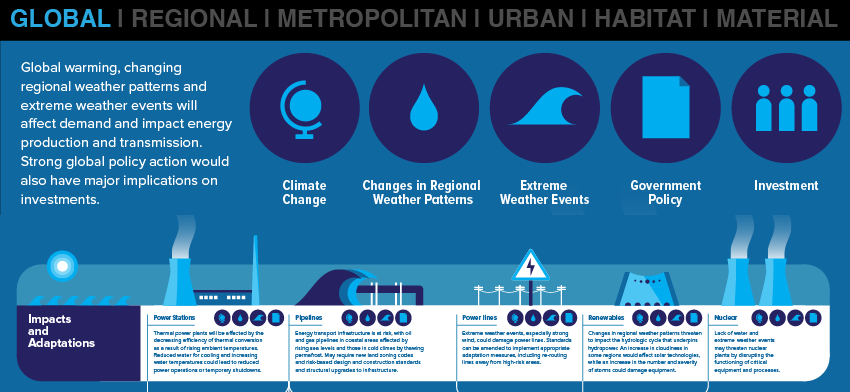
Energy Sector Faces Major Challenges from Climate Change
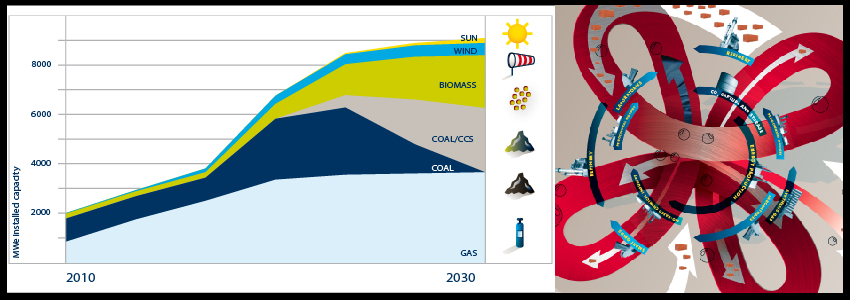
Without strong mitigation policies, the global average temperature is likely to rise above the internationally agreed 2°C target. As a major source of carbon emissions, the energy sector will be aected by mitigation policies as well as by climate impacts in multiple ways.
check out complete infographic: http://www.desmog.ca/sites/beta.desmogblog.com/files/IPCC_AR5__Implications_for_Energy__Infographic__WEB_EN.pdf
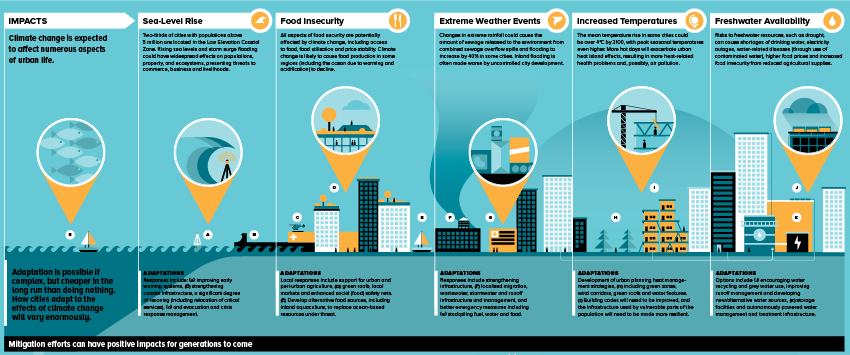
Cities on the front line of a changing climate
Urban centres account for more than half of the world’s population, most of its economic activity and the majority of energy-related emissions. The role of cities in reducing emissions and protecting their inhabitants is therefore central to effective climate policies.
check out complete infographic: http://www.desmog.ca/sites/beta.desmogblog.com/files/IPCC_AR5__Implications_for_Cities__Infographic__WEB_EN_0.pdff
Infographics extracted from: http://www.desmog.ca/2014/09/05/what-does-climate-adaptation-actually-look-check-out-awesome-new-infographic-series-cambridge
REGIONAL | The North Sea
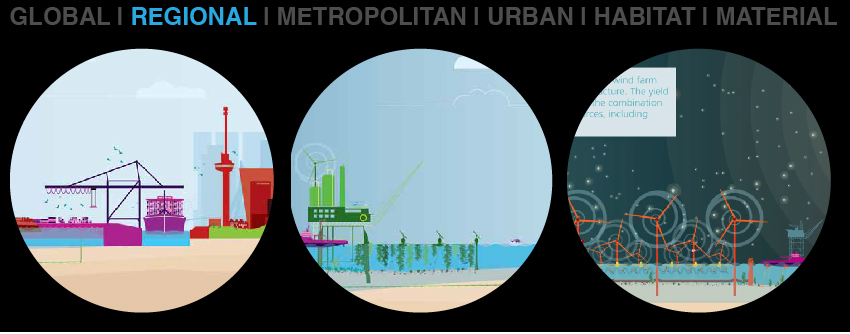
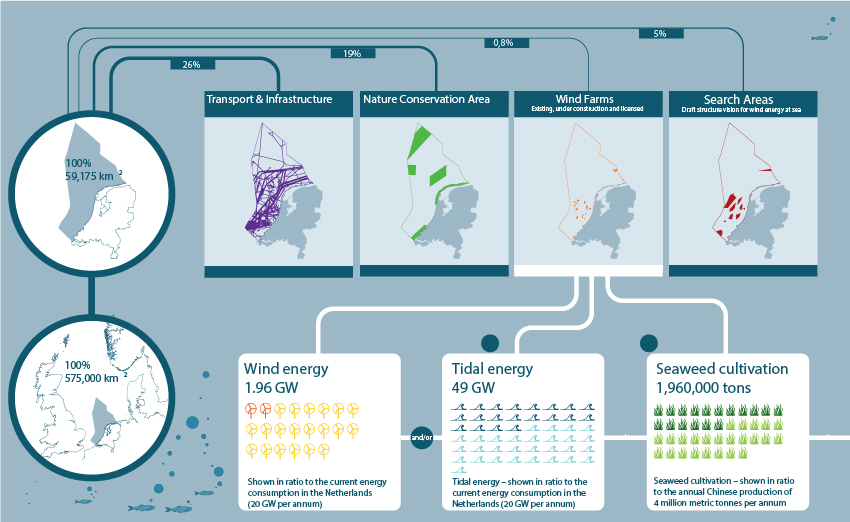
North Sea 2050 Spatial Agenda
From the vision on the North Sea in 2050, the spatial agenda mentions five themes on which I would like to focus:
1) building with North Sea nature;
2) energy transition at sea; challenge is to be economical with space and utilise opportunities to increase energy generation per square nautical mile. The market for tidal and wave energy is focussing increasingly on being able to convert lower current speeds and limited wave heights found in Dutch waters into electricity.
3) multiple/multi-functional use of the space;
4) connection between land and sea;
5) accessibility/shipping.
A day on the North Sea - 2050 from Must Stedebouw on Vimeo.
Opportunities for sustainable economic development of sea and coast
Extracted from: http://www.noordzeeloket.nl/en/Images/North%20Sea%202050%20Spatial%20Agenda_LO%20RES_3562.pdf
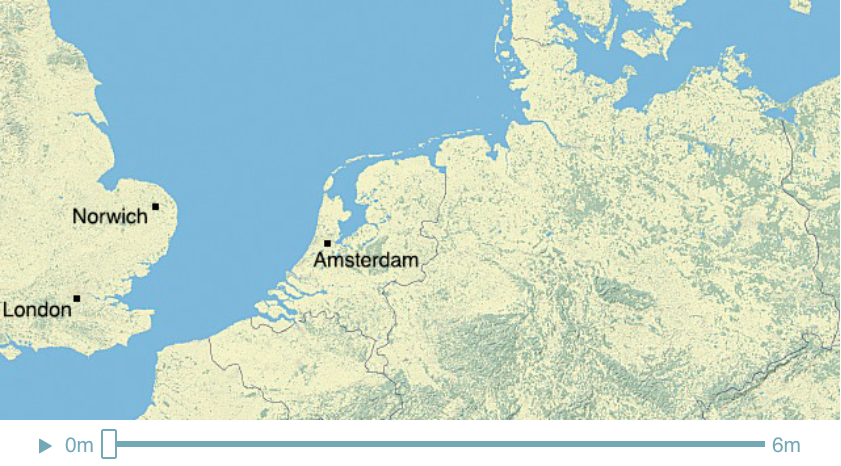
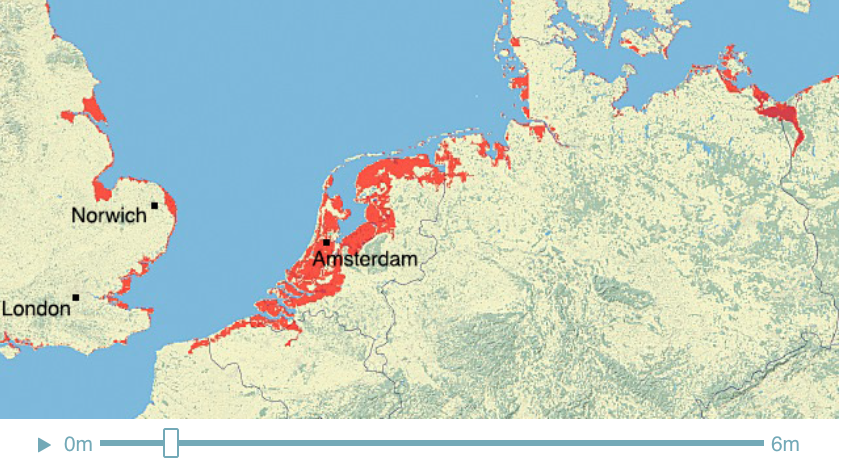
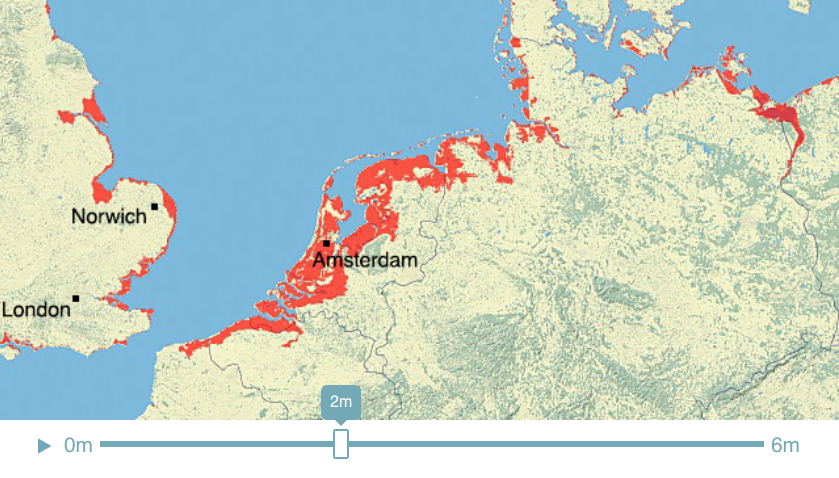
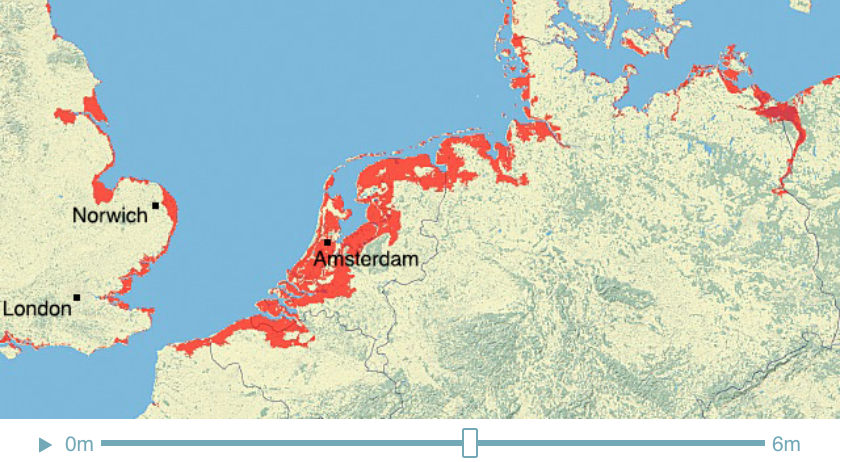
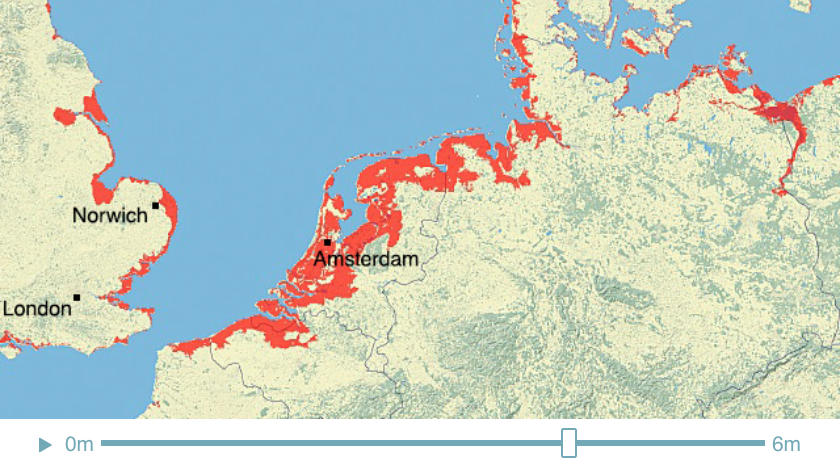
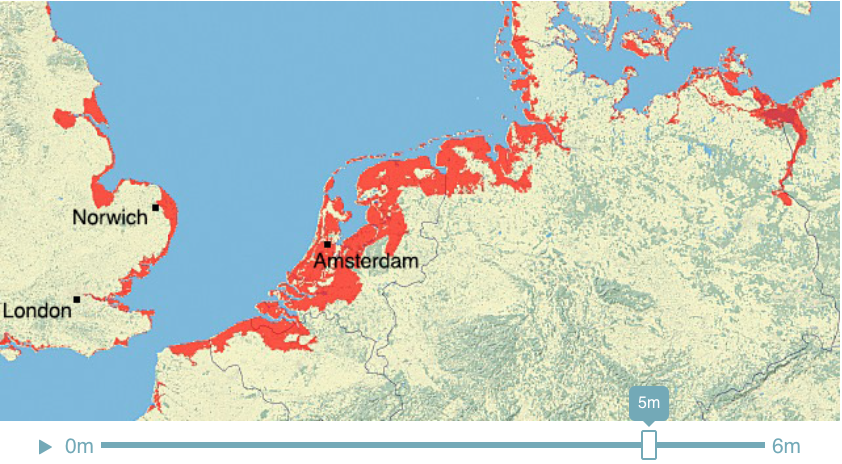
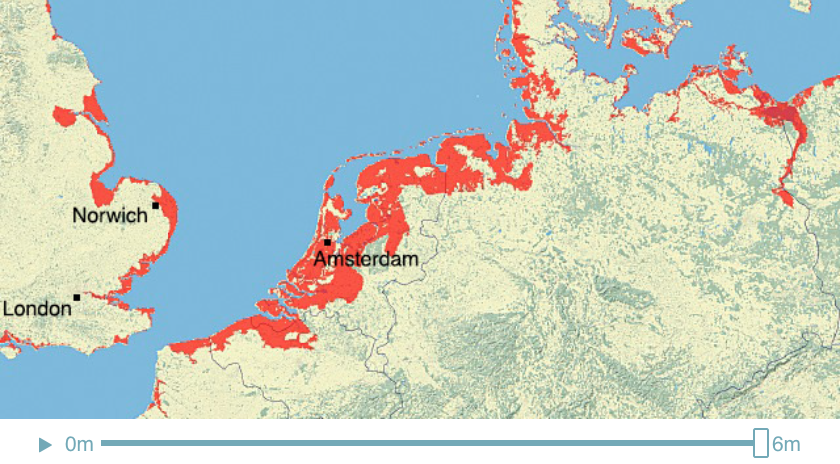
Climate Time Machine Sea Levels - North Sea
Recent satellite observations have detected a thinning of parts of the Greenland ice sheet at lower elevations. A partial melting of this ice sheet would cause a 1-meter (3-foot) rise. If melted completely, the Greenland ice sheet contains enough water to raise sea level by 5-7 meters (16-23 feet).
This visualization shows the effect on coastal regions for each meter of sea level rise, up to 6 meters (19.7 feet). Land that would be covered in water is shaded red.
Credit: Center for Remote Sensing of Ice Sheets - http://climate.nasa.gov/interactives/climate-time-machine
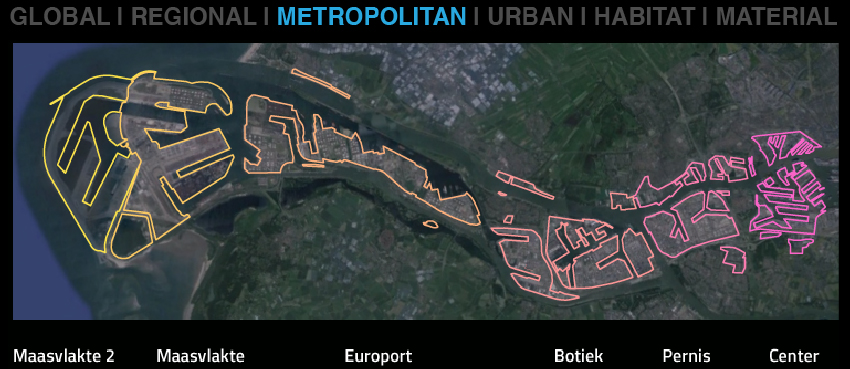
METROPOLITAN | Rotterdam
History of Rotterdam
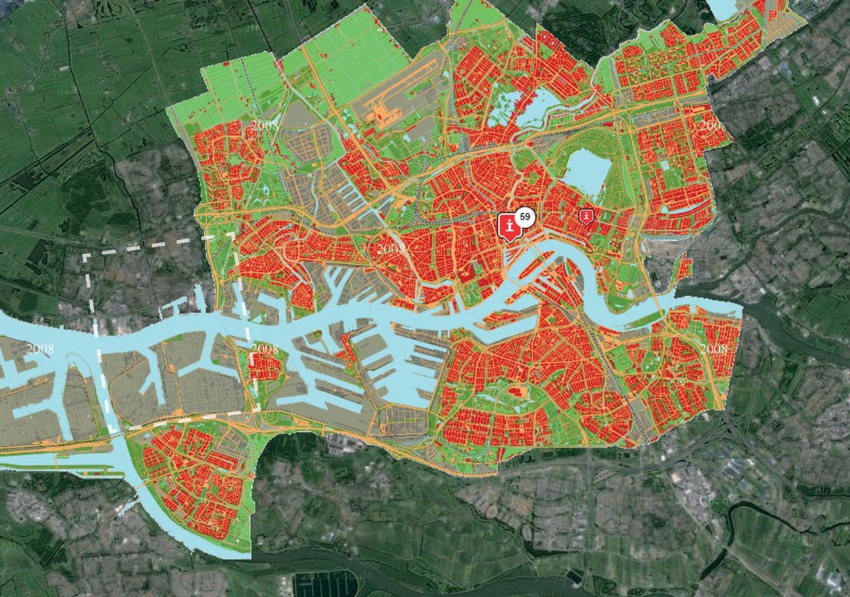
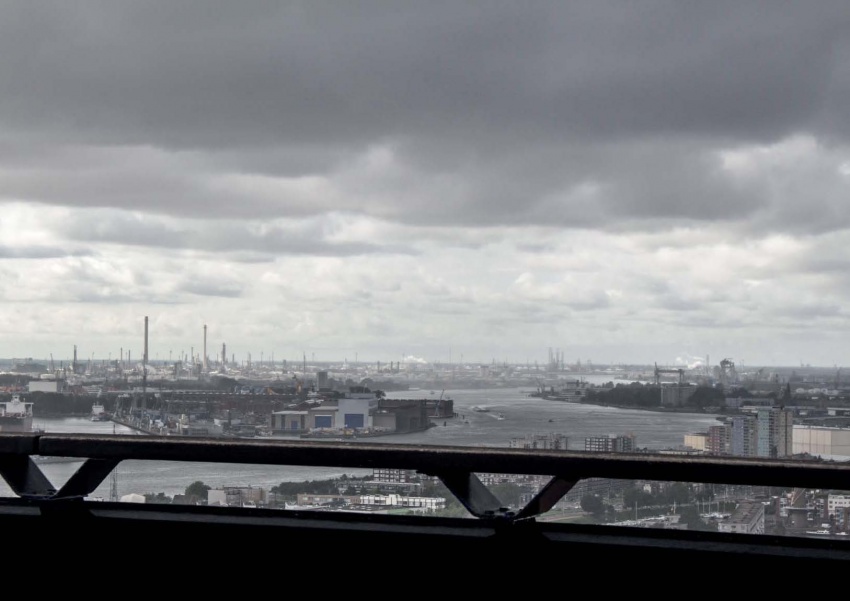
Image: View of Rotterdam from the Euromast
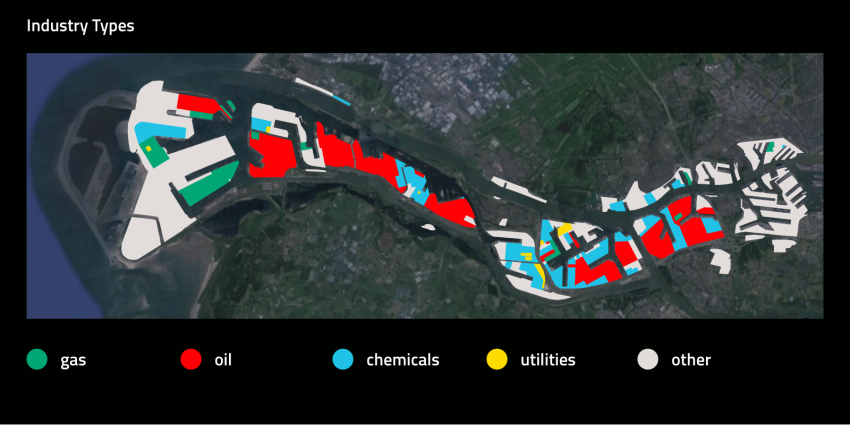
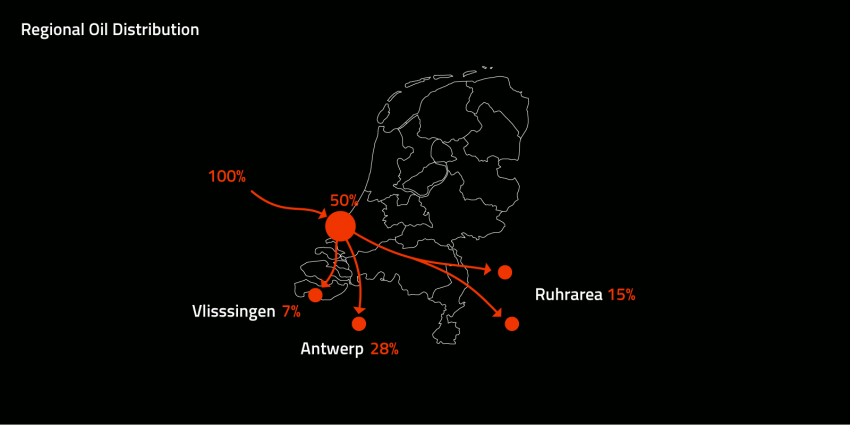
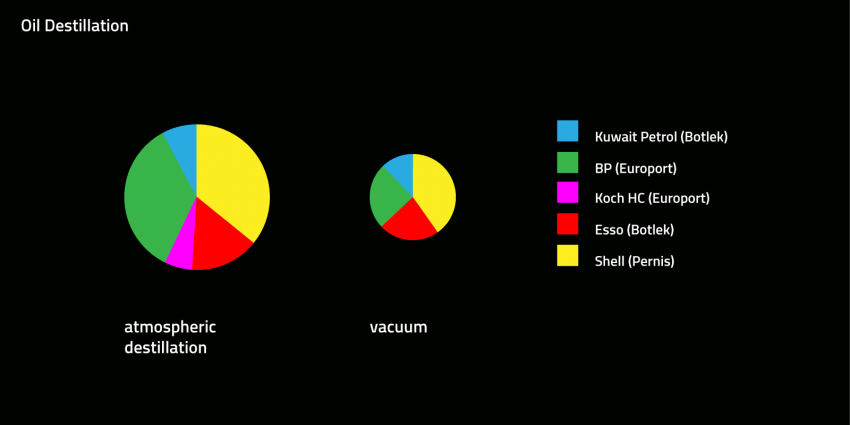
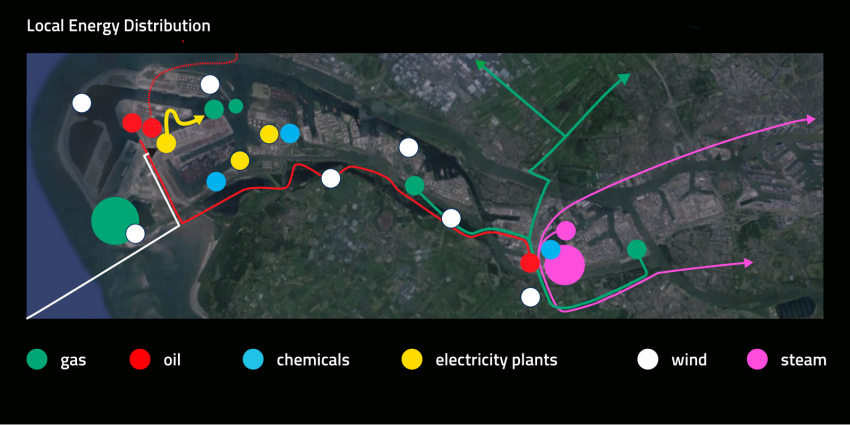
Rotterdam Today | Functions and Energy of the Region
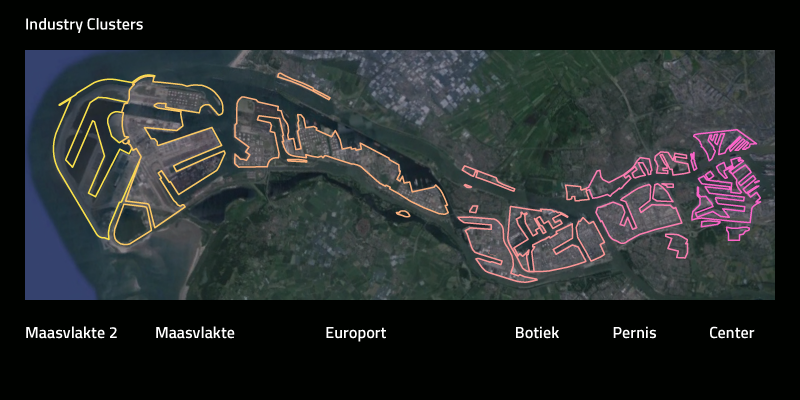
Rotterdam Tomorrow | Global Hub & Europe’s Industrial Cluster
Water Management & Biobased industry in Rotterdam
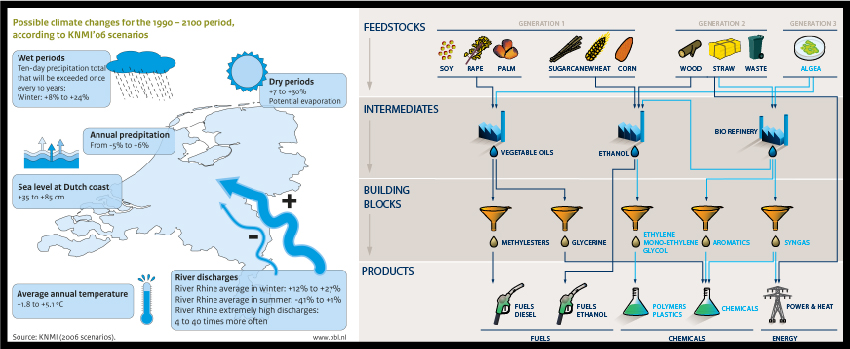
Extracted from: https://www.portofrotterdam.com/en/the-port/port-vision-2030
URBAN | The port
THE PAST | History of the port
PRESENT
The port of Rotterdam is the engine of the Dutch economy
> total port area of 10,500 ha = 16 000 football fields
> 90 000 people work in the port
> 300,000 people work in total and for the port
> handling 430 million tons, 11 million containers
> the largest port in Europe; No. 5 in the world
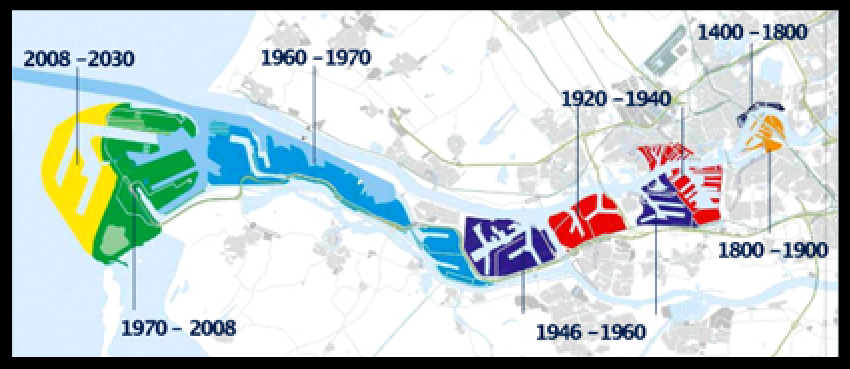
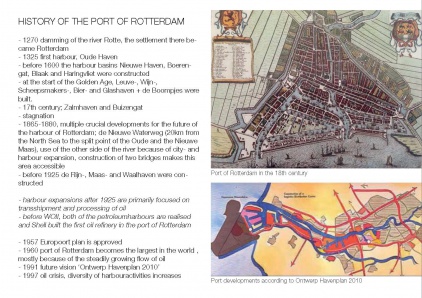
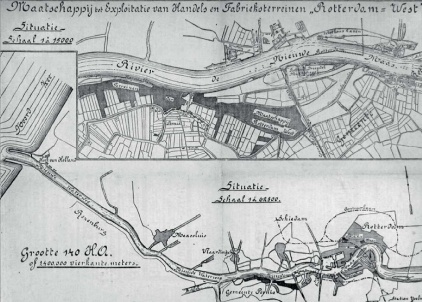
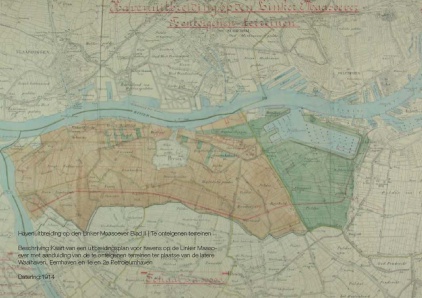
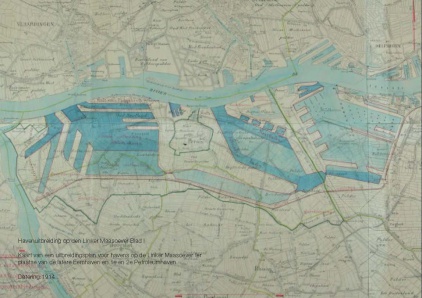
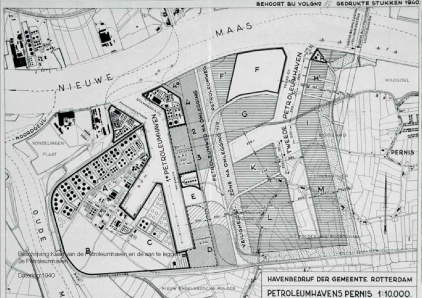
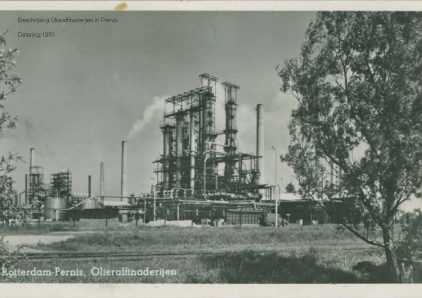
Since the inception of Rotterdam, in the Middle Ages had a port with a transfer function
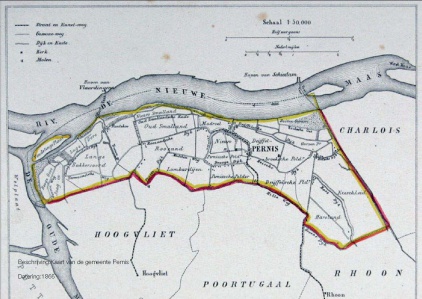
The High Street, part of Schielands High seafront, divided Rotterdam in a country town and a water city. In the city of waters the first ports were built, including the Old Port, the Haringvliet, Leuvehaven.
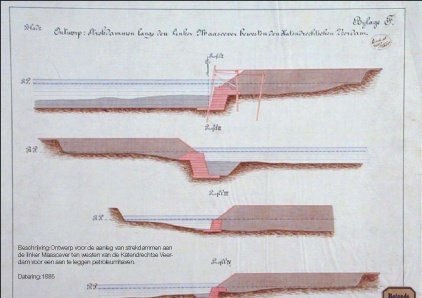
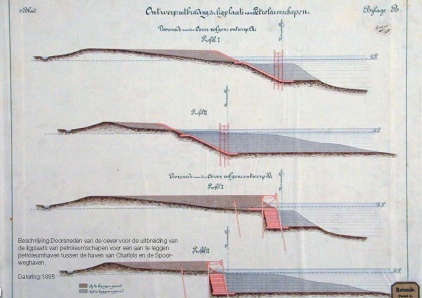
During the 19th century, Rotterdam was less accessible. Therefore, the New Waterway was dug so that Rotterdam had a direct connection to the sea.
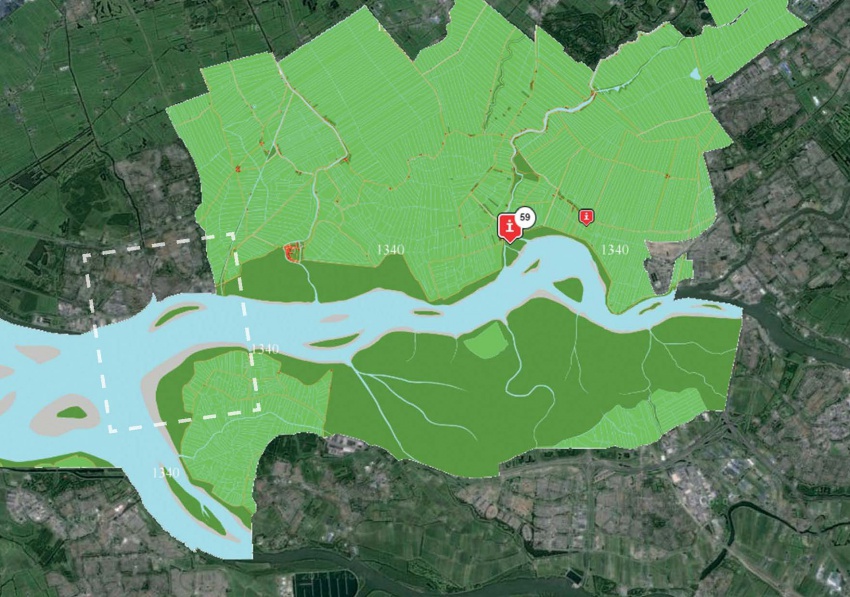
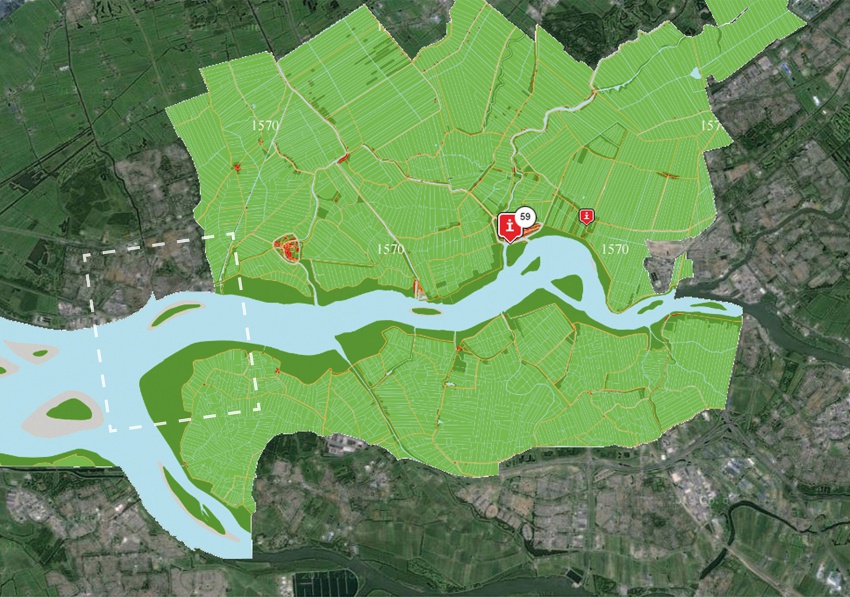
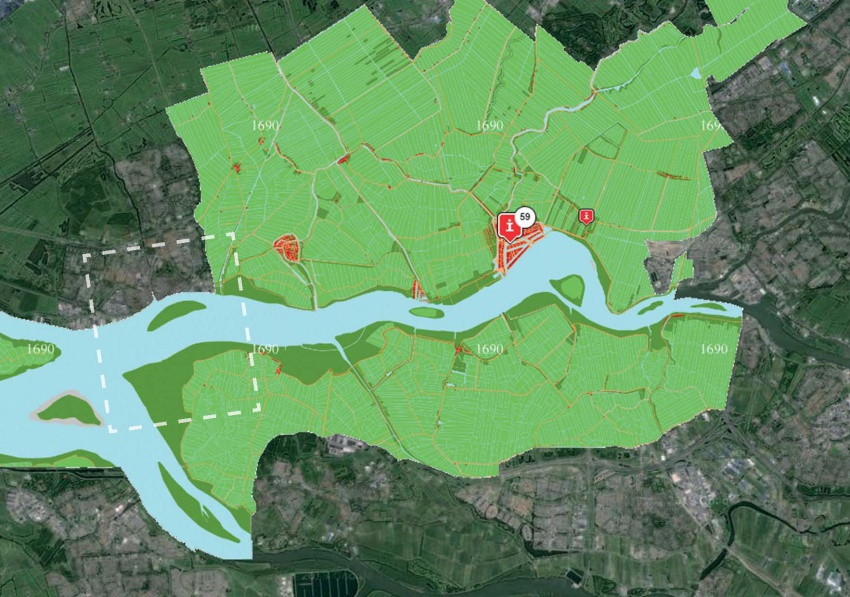
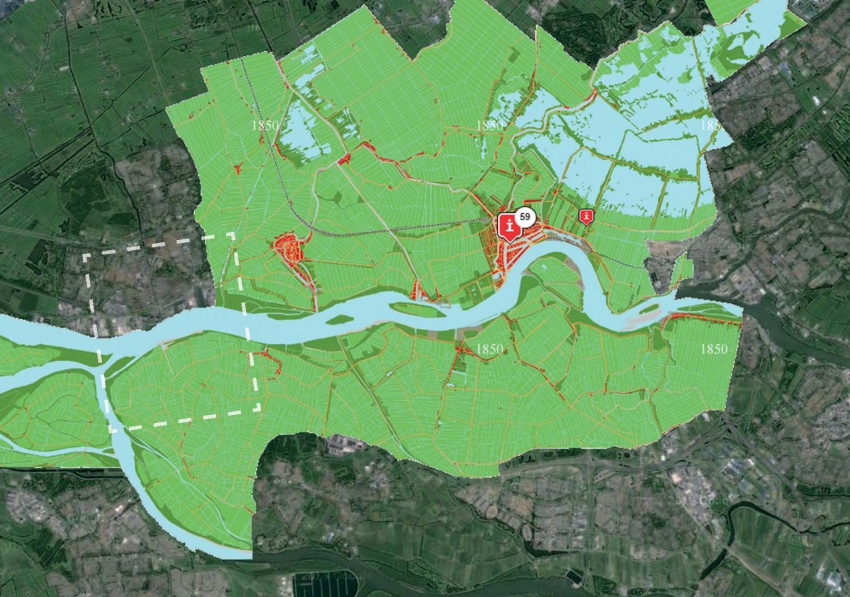
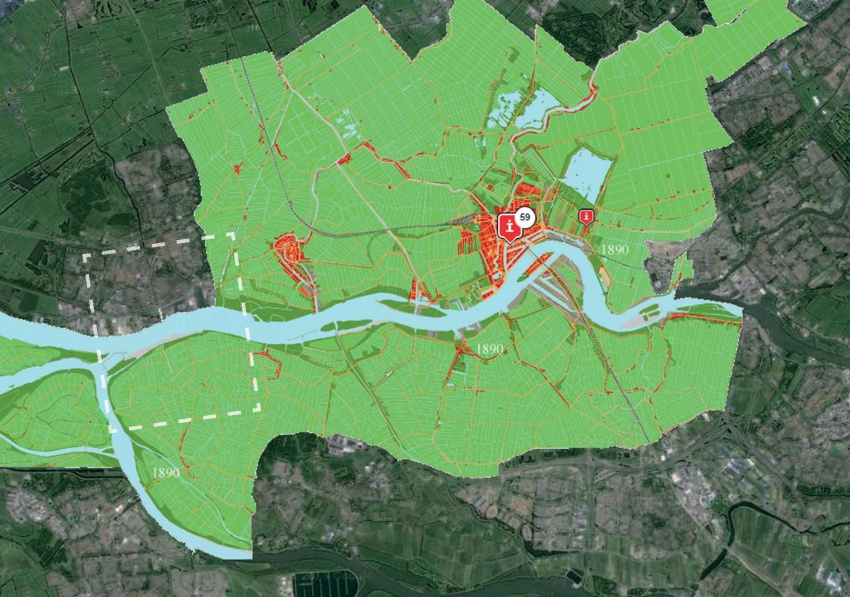
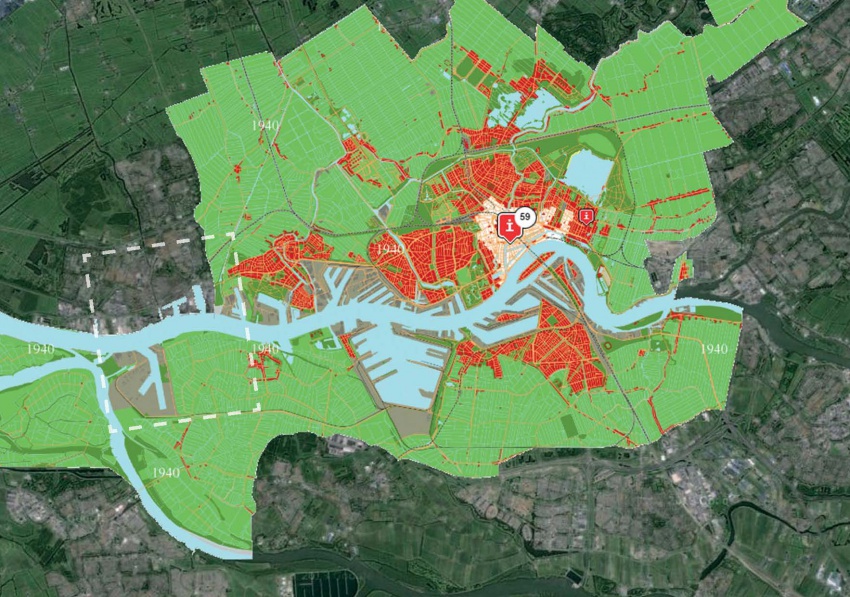
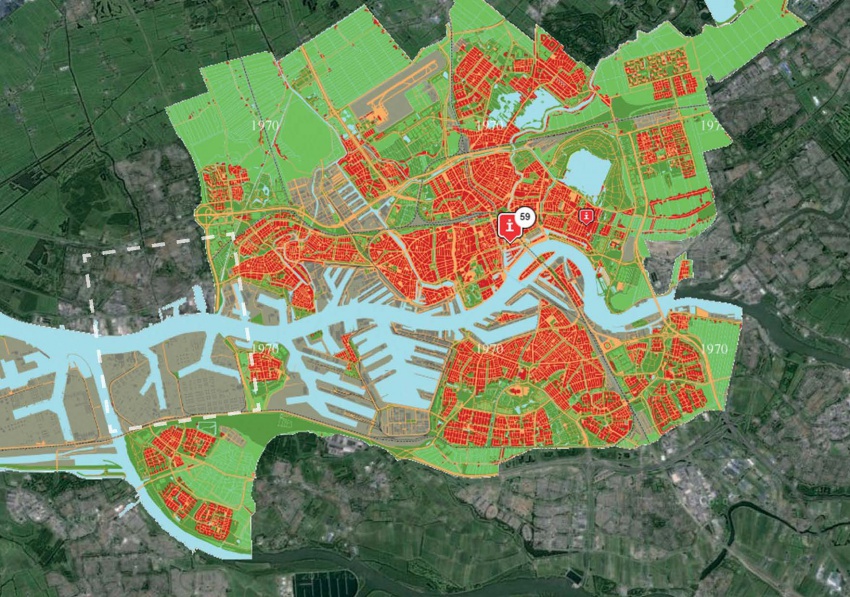
The landscapes of the port
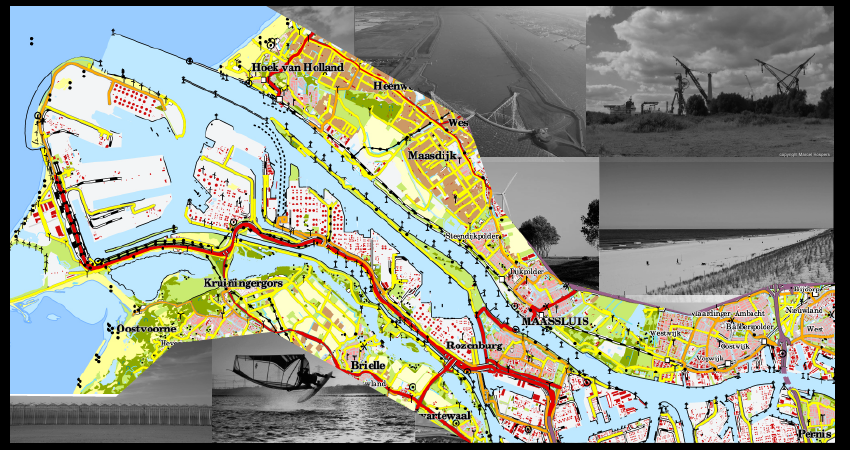
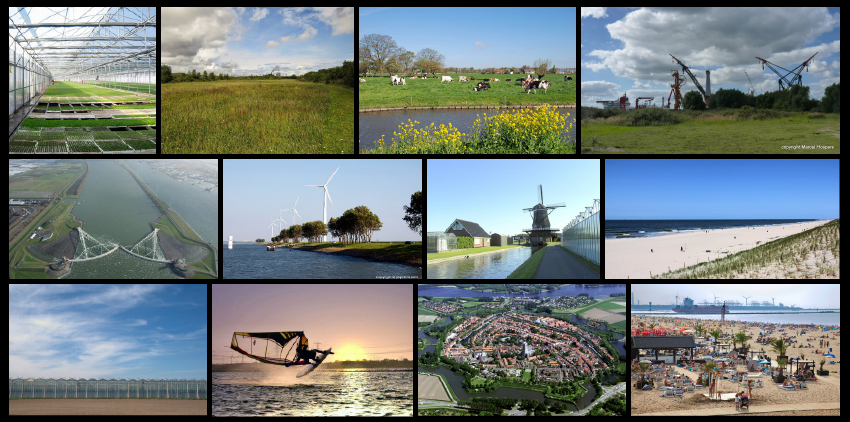
 http://www.geocaching.com/geocache/GC2YJ7C_amsterdam-trads-dikes-and-polders?guid=1b46e515-77b8-4cde-9d10-133ead2ab7ef
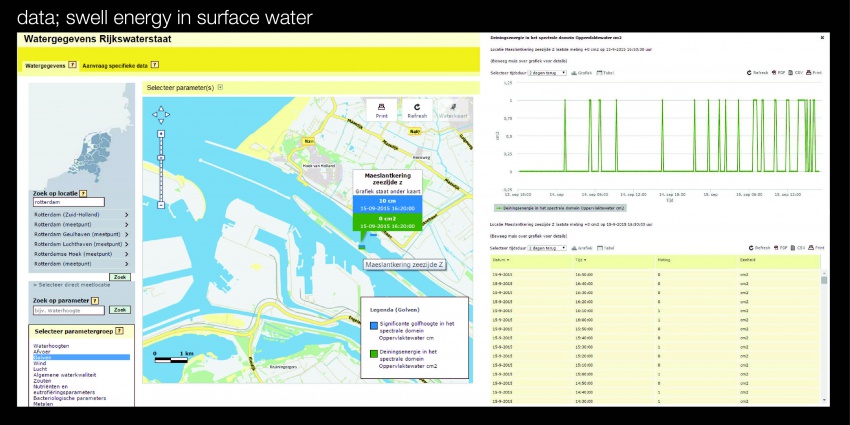
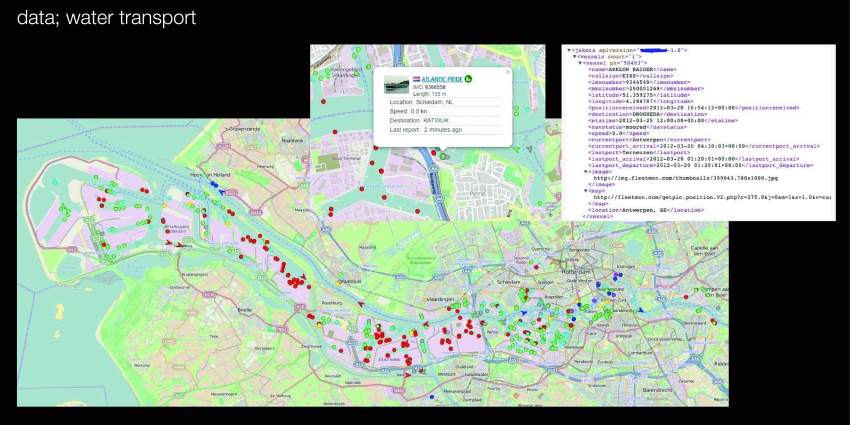
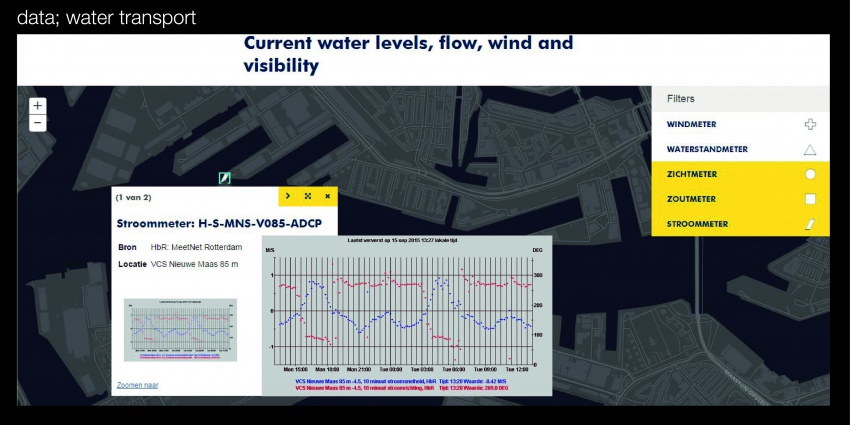
WATER Data of the port
FUTURE | Extension of the port
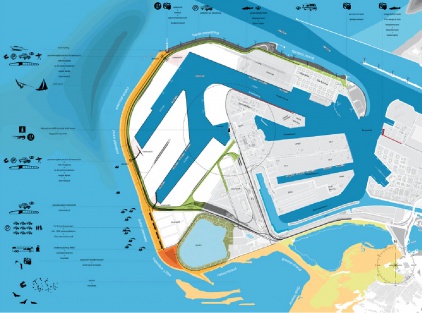
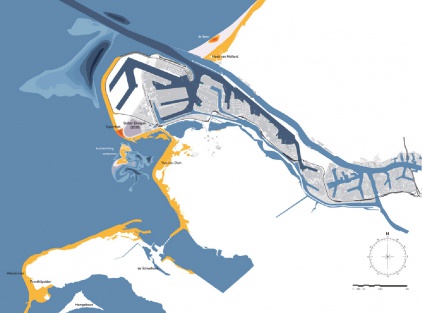
Maasvlakte 2 Landscape Plan
The Port of Rotterdam has planned a westward extension of its harbor area to provide for future growth. The land reclamation project called Tweede Maasvlakte (MV2 or “Second Maas Mudflats” - there is already a first Maasvlakte) is intended to provide space for industrial activities such as container transhipment, chemicals and distribution. The total area involved is about 2,000 hectares, of which 1,000 hectares nett is issuable for harbor, industrial and commercial activities.
Besides being an extension of the Port of Rotterdam, the MV2 plan has a coastal extension component. New sand dunes and dykes will be required to assure the safety of the land reclaimed form the North Sea. The target for the start of land reclamation and the sand excavation which will make it possible is in 2008.
The Port of Rotterdam intends to combine the creation of land for new harbor activities on MV2 with space for recreation and new nature areas. H+N+S was invited to prepare a plan for this “harbor landscape” in 2007. There are three aspect of the harbor which affect the design and landscaping of MV2. Firstly, there is the technical reality of the harbor industry; secondly, a harbor for nature; and thirdly, an accessible, attractive harbor for the public. In the master landscape plan for MV2, H+N+S has combined these three “realms” or “themes” into an appealing concept, and has also worked out detailed landscaping designs. The outcome is a sturdy, large-scaled landscape with long lines of sight, robust viaducts, a large beach for high-capacity leisure use and a “super lookout dune”. There is also room for a bird valley, moist dune valleys and bird-spotting sites.
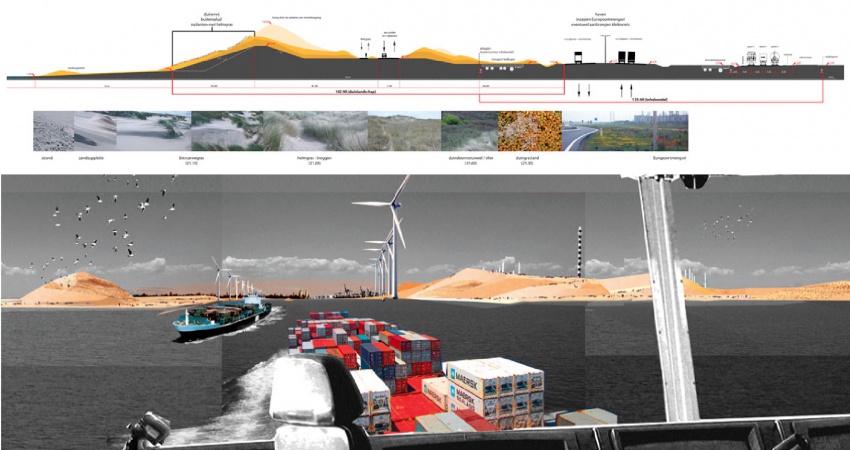 http://www.hnsland.nl/index.php?option=com_content&view=article&id=131:maasvlakte-2-landscape-plan&catid=29:projects&Itemid=64&lang=en-GB
Port Vision 2030
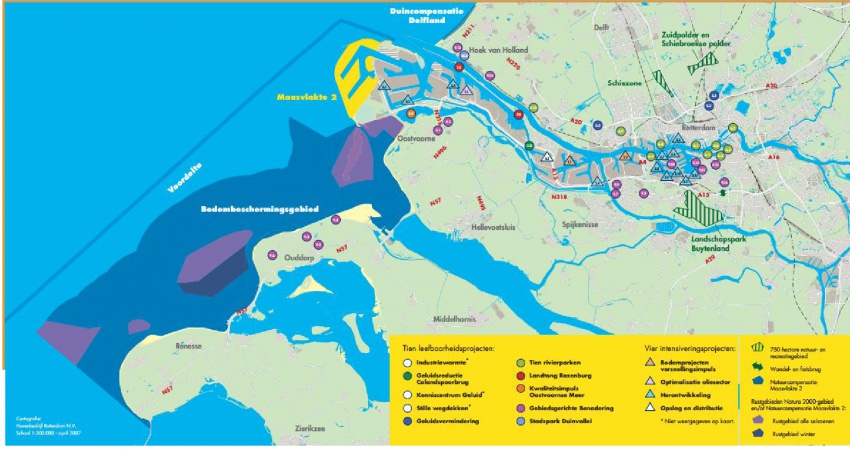 Extracted from: https://www.portofrotterdam.com/en/the-port/port-vision-2030
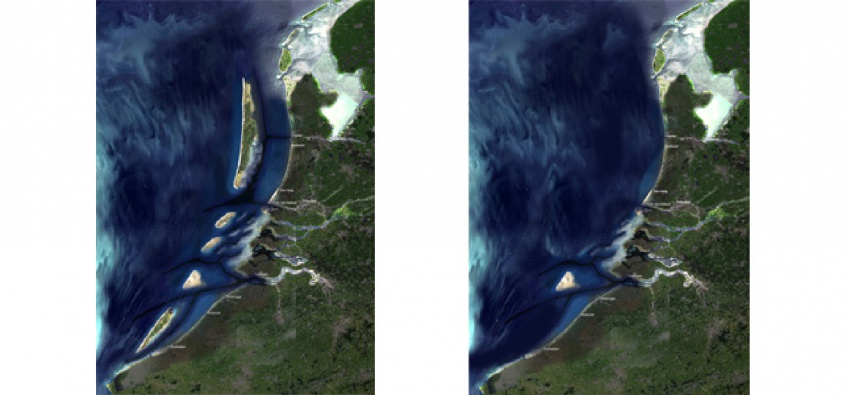
The Happy Isles Consortium
The Happy Isles Consortium - West 8 and Svasek– drew up a plan which combines an agenda for safety, and the necessity of new land. The participants offer the metropolis a new perspective by proposing a series of new, sprayed-up sand islands off the coast of Belgium and The Netherlands. These dune islands, measuring up to 150.000 hectares in size, will break the increasing waves. Also, thanks to ingenious engineering of the gullies, the off-shore under tow will cause the sea level to drop during north-western storms.
On the biggest island, Hollandsoog, 150.000-200.000 ha. in size, a broad representation of the community will be able to obtain a lease. The economy of this island will be based on leisure and nature experience; a happy island for family, lonely-hearts, poets and festivals.
http://www.west8.nl/projects/all/happy_isles/
LOCAL | The site
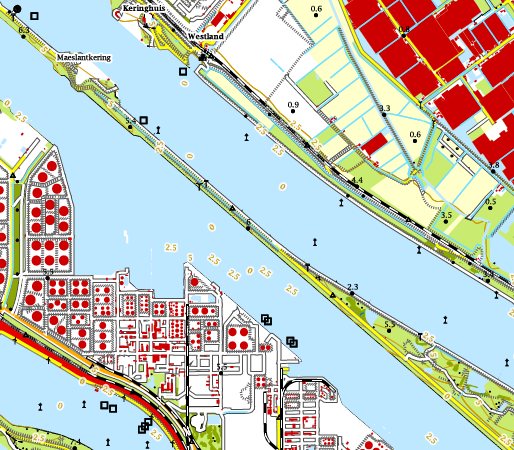
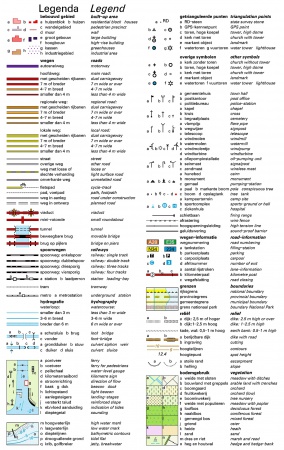
Site Topology
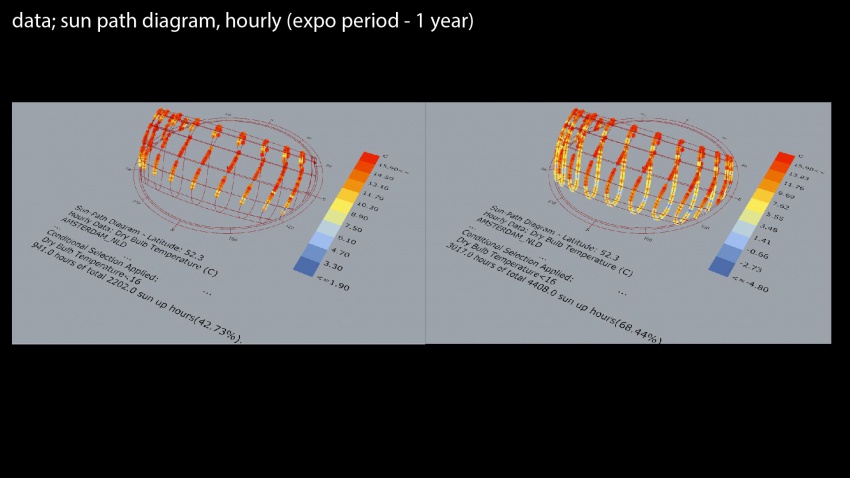
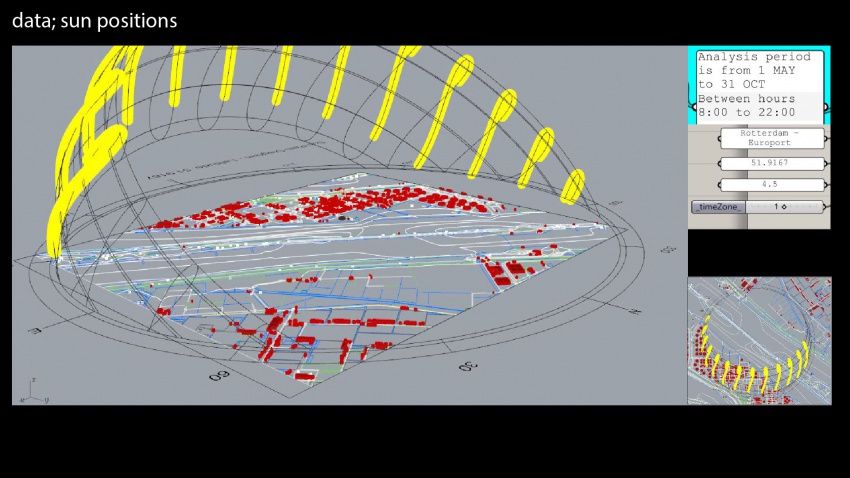
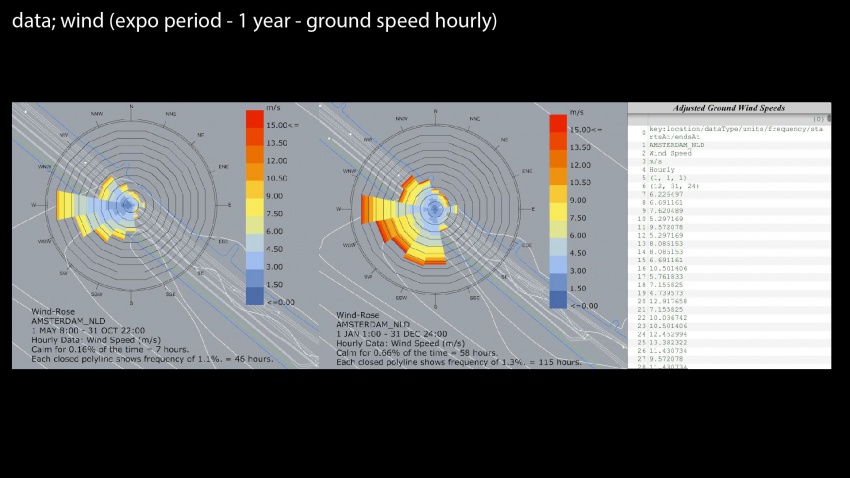
Refinery View
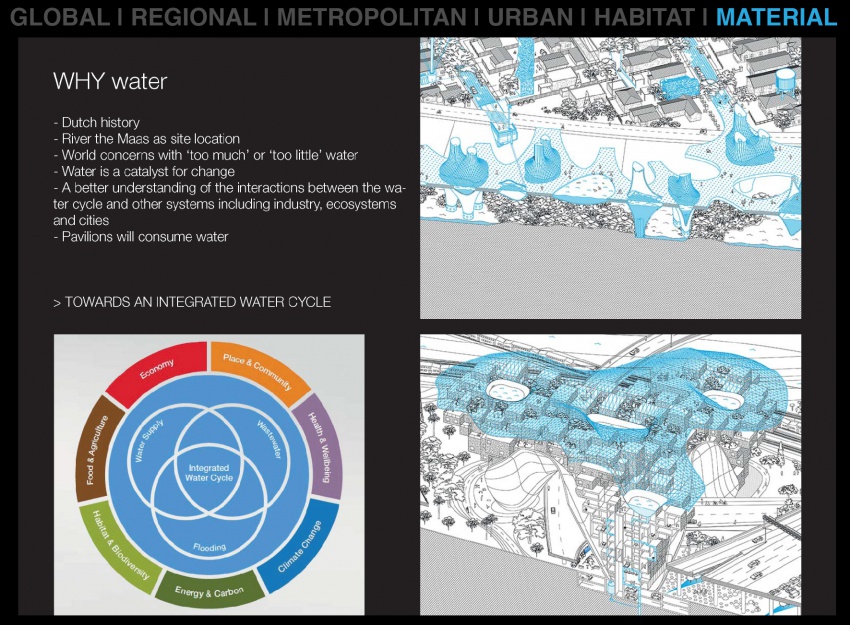
MATERIAL | water
Water & Energy
group design


